- Introduction
- Setting Up Splunk Attack Range
- Download VM (AMI)
- Import into VirtualBox
- Setting up Suricata and Splunk Forwarding
- Simulating Windows Attacks
- Simulating and Detecting Network Attacks
- Custom Rule and Alert Creation / Portfolio
- Creating Dashboards
- Key Findings and Results for Splunk Engineering Project
- Supporting Materials
Introduction
- After my SOC Internship, I realized I had no experience in Splunk Engineering. Wanting to create a lab environment to set up the detection of attacks and play the role of a Security Engineer, I freehanded a Splunk project without following any guides, and dug up a little-known simulated attack scenario made by Splunk, called the Splunk Attack Range, and the Network Flight Simulator tool.
- Splunk Attack Range quickly setup
- 1 Domain Controller with Red Team Tools, Domain Controller Realistic Objects, and an MITRE Caldera Agent on the Windows Server.
- 1 Member Server
- A Linux Server
- A Suricata Server
- I also set Suricata for network alerts on an original Snort Server that the Splunk Attack Range deployed and set up 8 rulesets that covered DGA, Cryptomining Traffic, and SSH Exfiltration traffic, for a few examples.
After completing my SOC internship, I realized a significant gap in my skillset: I had little experience in Splunk Engineering. To bridge this gap, I decided to create a comprehensive lab environment where I could simulate attacks, develop detection mechanisms, and take on the role of a Security Engineer. Rather than relying on pre-existing guides, I took a hands-on, self-directed approach, leveraging Splunk’s powerful capabilities and exploring tools like the Splunk Attack Range and Network Flight Simulator.
This post is meant to be half guide, and half portfolio, showcasing both how to set it up but then also showing what I did with it with my Detections, Dashboards, and ability to set everything up. This project took me around 2 months to complete.
The Splunk Attack Range provided a robust framework to simulate real-world scenarios and analyze logs in a controlled environment. The design allowed me to simulate any adversary playbook out of the MITRE catalog using either Atomic Red Team or PurpleSharp. I designed and deployed a simulated network that included:
- 1 Domain Controller: Configured with realistic Active Directory objects, Red Team tools, and an MITRE Caldera agent for attack automation.
- 1 Member Server: Acting as a secondary Windows machine to emulate realistic enterprise operations.
- 1 Linux Server: Serving as a versatile node for multi-OS threat simulations.
- 1 Suricata Server: Configured to monitor network activity and generate actionable alerts.
Additionally, I set up Suricata on a Snort server deployed by the Splunk Attack Range, enhancing its functionality by creating 8 custom rulesets. These rules were tailored to detect various attack scenarios, including Domain Generation Algorithm (DGA) traffic, cryptomining activity, and SSH exfiltration attempts. This configuration allowed me to integrate both host-based and network-based detection mechanisms seamlessly into my lab environment.
Through this project, I not only gained hands-on experience in setting up and managing Splunk infrastructure but also developed detection rules, dashboards, and alerting mechanisms to identify and respond to simulated Active Directory (AD) attacks.
Setting Up Splunk Attack Range
- Setting up the Splunk Attack Range was something that took me days of trial and error, with none of the online guides correctly showing me the correct steps, even the official guide missing steps. At first, I wanted to do the attack range locally, but it was deprecated, causing me to put it on AWS EC2. The Windows machines cost a lot to operate, so I highly suggest setting this up ASAP and downloading it to a VM, having AWS be only temporary. The machines other than the Splunk Enterprise Machine server as a vector for log generation and aren’t important to the configuration of the purposes of the lab, therefore, we only download the Splunk machine at the end.
Setup IAM and AWS Pre-setup
- In IAM make sure you have a user, with an active access key online and set a password. This will come in handy later as you setup the range.
- Give yourself the AmzonEC2FullAccess, AmazonS3FullAccess, and AWSEC2VssSnapshotPolicy roles.
Range Commands:
- I setup a Ubuntu EC2 with Ubuntu 22.04 with ~6 cores of CPU, and grabbed the ssh key from my instance and opened up port 22.
- Here’s how to set it up:
sudo apt update
sudo apt install software-properties-common
sudo add-apt-repository ppa:deadsnakes/ppa
# Press ENTER
sudo apt install python3.8
# Verify
python3.8 --version
sudo su
apt-get update
apt-get install -y python3.8 git unzip python3-pip curl
curl -s https://releases.hashicorp.com/terraform/1.9.8/terraform_1.9.8_linux_amd64.zip -o terraform.zip && \
unzip terraform.zip && \
mv terraform /usr/local/bin/
git clone https://github.com/splunk/attack_range.git
cd attack_range
curl "https://awscli.amazonaws.com/awscli-exe-linux-x86_64.zip" -o "awscliv2.zip"
unzip awscliv2.zip
sudo ./aws/install
aws configure
# Enter in IAM Access Key and Password from AWS IAM which you have to setup in AWS
apt install python3-poetry
apt install python3.10-venv
python3 -m venv venv
source venv/bin/activate
pip install -r requirements.txt
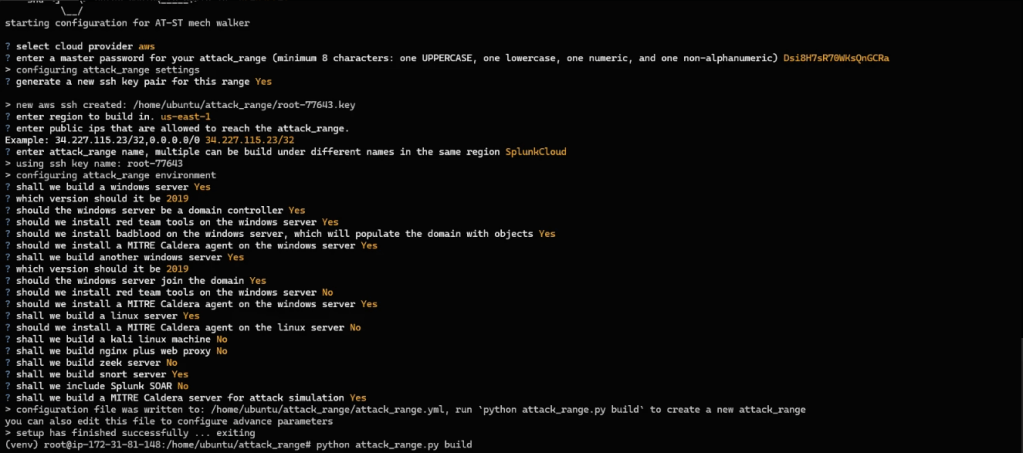
python attack_range.py configure
python attack_range.py buildHere is what I setup:
Windows Server as Domain Controller
- Reason: A Domain Controller is critical in any Active Directory environment, making it a primary target for attackers.
- Key Use: Simulates realistic attacks such as credential dumping, Kerberoasting, or lateral movement.
- Added Value: Includes BadBlood to populate the domain with objects like users, groups, and computers, creating a realistic AD environment.
Red Team Tools on the Windows Server
- Reason: Pre-installed Red Team tools (e.g., PowerSploit, Mimikatz) allow for automated or manual attack simulations.
- Key Use: Test detection capabilities for credential theft, privilege escalation, or persistence tactics.
MITRE Caldera Agent
- Reason: Automates adversary emulation, providing consistent, repeatable attack scenarios based on MITRE ATT&CK techniques.
- Key Use: Enables realistic attack workflows to evaluate the effectiveness of detection and response mechanisms.
Linux Server
- Reason: Adds diversity to the environment, representing typical multi-OS enterprise setups.
- Key Use: Simulates attacks like SSH brute force, privilege escalation, or data exfiltration.
Suricata Server
- Reason: Suricata is a robust IDS/IPS tool for network traffic monitoring.
- Key Use: Generates alerts for malicious traffic (e.g., DGA, cryptomining, SSH exfiltration) and integrates network-based threat detection into the lab.
Realism
- Active Directory Environment:
- By setting up a populated domain with objects, the environment mimics real-world enterprise networks.
- This is essential for testing AD-related attack vectors and their detection via Splunk dashboards.
- Simulated Network Traffic:
- The inclusion of Suricata ensures network traffic monitoring, adding another layer of realism by detecting anomalous or malicious traffic patterns.
After building the attack range, run the attacks from Atomic Red Team and Purple Sharp. I followed the Atomic Red Team and Purple Sharp documentation. For reference, these were the commands I ran:
python attack_range.py simulate -e ART -te T1110.001 -t ar-win-root-57024-attrange-0 && \
python attack_range.py simulate -e ART -te T1566.001 -t ar-win-root-57024-attrange-0 && \
python attack_range.py simulate -e PurpleSharp -te T1087.002 -t ar-win-root-57024-attrange-0 && \
python attack_range.py simulate -e ART -te T1615 -t ar-win-root-57024-attrange-0 && \
python attack_range.py simulate -e PurpleSharp -te T1558.003 -t ar-win-root-57024-attrange-0 && \
python attack_range.py simulate -e ART -te T1134.001 -t ar-win-root-57024-attrange-0 && \
python attack_range.py simulate -e ART -te T1136.001 -t ar-win-root-57024-attrange-0 && \
python attack_range.py simulate -e ART -te T1547.001 -t ar-win-root-57024-attrange-0 && \
python attack_range.py simulate -e PurpleSharp -te T1550.002 -t ar-win-root-57024-attrange-0 && \
python attack_range.py simulate -e PurpleSharp -te T1105 -t ar-win-root-57024-attrange-0 && \
python attack_range.py simulate -e ART -te T1071.001 -t ar-win-root-57024-attrange-0 && \
python attack_range.py simulate -e PurpleSharp -te T1059.001 -t ar-win-root-57024-attrange-0 && \
python attack_range.py simulate -e ART -te T1560.001 -t ar-win-root-57024-attrange-0 && \
python attack_range.py simulate -e ART -te T1048.002 -t ar-win-root-57024-attrange-0- Once these commands are run, you can open port 8000 in the security groups in the Splunk EC2 instance to access Splunk Enterprise from your host and check if logs are coming in.
- Make sure to change your password on the Splunk Instance and have that noted down, or else you won’t have a user setup once you download.
- Then, we need to download the EC2 so that we don’t pay the expensive EC2 fees. Make sure to have your Amazon bucket set up.
Download VM (AMI)
Create AMI
- Log in to the AWS Management Console.
- Navigate to EC2 Dashboard.
- Select the EC2 Instance:
- Click on Instances in the left panel.
- Select the instance you want to create an AMI from.
- Create Image:
- Click Actions > Image and templates > Create Image.
- Configure the AMI:
- Provide a name and description for the AMI.
- Choose whether to reboot the instance (default is Yes for consistency).
- Review Storage Settings:
- Confirm the storage settings. Snapshots will be created for the root volume.
- Create the AMI:
- Click Create Image.
Export Configuration
- Attach an access control list (ACL) to your S3 bucket containing the following grant:
c4d8eabf8db69dbe46bfe0e517100c554f01200b104d59cd408e777ba442a322
- Then open up the AWS CloudShell at the bottom of AWS, create the
.jsonfiles and then run the command.
nano trust-policy.jsonaws iam create-role --role-name vmimport --assume-role-policy-document file://trust-policy.json
{
    "Version": "2012-10-17",
    "Statement": [
        {
            "Effect": "Allow",
            "Principal": { "Service": "vmie.amazonaws.com" },
            "Action": "sts:AssumeRole",
            "Condition": {
                "StringEquals":{
                    "sts:Externalid": "vmimport"
                }
            }
        }
    ]
}- nano role-policy.json
- aws iam put-role-policy --role-name vmimport --policy-name vmimport --policy-document file://role-policy.json
{
    "Version": "2012-10-17",
    "Statement": [
        {
            "Effect": "Allow",
            "Action": [
                "s3:GetBucketLocation",
                "s3:GetObject",
                "s3:ListBucket"
            ],
            "Resource": [
                "arn:aws:s3:::disk-image-file-bucket",
                "arn:aws:s3:::disk-image-file-bucket/*"
            ]
        },
        {
            "Effect": "Allow",
            "Action": [
                "ec2:ModifySnapshotAttribute",
                "ec2:CopySnapshot",
                "ec2:RegisterImage",
                "ec2:Describe*"
            ],
            "Resource": "*"
        }
    ]
}
nano bucket-policy.jsonaws s3api put-bucket-policy --bucket [BUCKET-NAME] --policy file://bucket-policy.json
{
    "Version": "2012-10-17",
    "Statement": [
        {
            "Sid": "AllowVmimportRoleAccess",
            "Effect": "Allow",
            "Principal": {
                "AWS": "arn:aws:iam::140023402803:role/vmimport"
            },
            "Action": [
                "s3:PutObject",
                "s3:GetBucketLocation",
                "s3:ListBucket"
            ],
            "Resource": [
                "arn:aws:s3:::[BUCKET-NAME]",
                "arn:aws:s3:::[BUCKET-NAME]/*"
            ]
        }
    ]
}
aws s3api get-bucket-policy --bucket [BUCKET-NAME]
aws ec2 export-image \
    --image-id [AMI] \
    --disk-image-format VMDK \
--s3-export-location S3Bucket=[BUCKET-NAME],S3Prefix=exports/- The vmdk file will take a very long time to export, maybe even overnight.
Import into VirtualBox
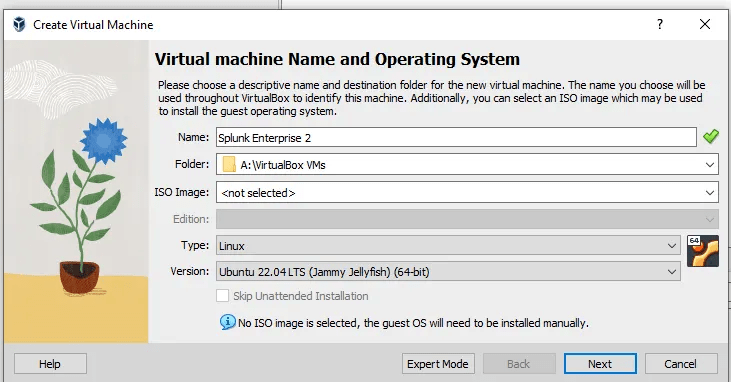
- I have at least 8 processors and 3000 MB of Memory.
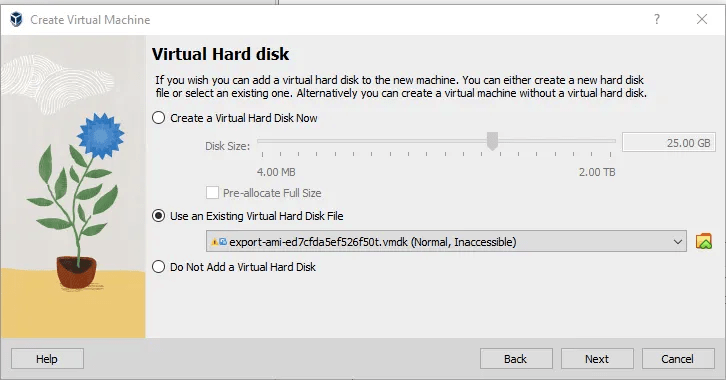
- Then, bring in the Existing Virtual Hard Disk .vmdk.
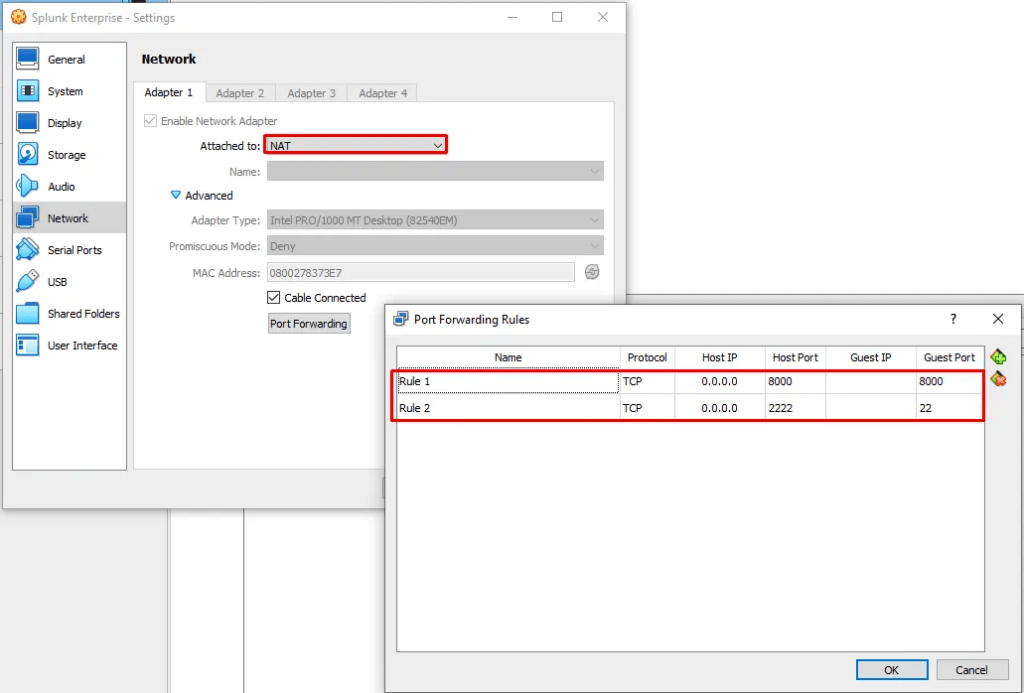
VM Networking
- Setup your Splunk Box with NAT and these two Port Forwarding Rules.
- These two rules are allowing you to access your Splunk via 127.0.0.1:8000 on your host web browser, and ssh to configure the machine - since the VM download doesn't allow copy and paste even with the Bidirectional copy and paste online.
To set SSH (On the Splunk machine):
sudo apt update
sudo apt install openssh-server
sudo ufw allow ssh
sudo ufw enable- On your host machine, in PowerShell:
ssh-keygen -t rsa -b 4096 -C "[YOUR COMMENT]"
# Press Enter until you get to your passphrase- Upload the id_rsa.pub file to the VM using S3 bucket or a method of your choice. Then move the file to
/home/[user]/.ssh/ - If you encounter problems, make sure the private and public key are matching.
chmod 700 /home/ubuntu/.ssh
chmod 600 /home/ubuntu/.ssh/authorized_keys
cat "<your-public-key>" >> /home/ubuntu/.ssh/authorized_keys
sudo systemctl restart ssh- On the host run
ssh -p 2222 ubuntu@127.0.0.1
Setup Splunk Locally:
# Check status
sudo /opt/splunk/bin/splunk status

# To start
sudo /opt/splunk/bin/splunk start

# Modify web configuration file
# Make sure these are under [settings]
enableSplunkWeb= true
httpport=8000
httpServer = 0.0.0.0
Setting up Suricata and Splunk Forwarding
- On pretty much any Linux VM, setup Suricata as so:
- I also make sure that machine can ping my splunk machine.
- I chose to do a packet capture on any other VM and then run the pcap through the rules, but you can certainly have live packets transfer from VM > Suricata Server > Splunk.
sudo apt update
sudo apt install suricata
# Verify
suricata --version- I set up my suricata.yaml (main configuration file) [
/etc/suricata/suricata.yml] as so: - The file is very long so it's on Pastebin.
- https://pastebin.com/9kYzccHb
Key Special Additions or Modifications in the suricata.yaml File:
- Custom
HOME_NETandEXTERNAL_NETDefinitions:HOME_NET:[172.31.47.27/20, 10.0.1.60/24]- Specific subnets are defined instead of generic ones like
192.168.0.0/16.
- Specific subnets are defined instead of generic ones like
EXTERNAL_NET:!$HOME_NET- Automatically sets everything outside
HOME_NETas external, a common best practice.
- Automatically sets everything outside
- Enhanced Logging Outputs:
- Multiple output configurations:
eve-loghas an additional alert-specific file:/var/log/suricata/alerts-only.json.- Enables logging for alerts only, keeping this file focused on actionable events.
stats.logis enabled to track thread and packet statistics.
- Multiple output configurations:
- Specific Network Interface Configuration:
- The
af-packetcapture interface is set toens5:
- The
- Custom Rule Paths and Files:
- Specific rule files for targeted detection (
dga.rules,ssh-transfer.rules, etc.). - Indicates a focus on specific threats like DNS tunneling and SSH-based data exfiltration.
- Specific rule files for targeted detection (
- I added the alerts-only.json in the
eve-logsection, added my rules underrule-files. - Two directories to have in your back pocket for Suricata are:
/var/log/suricata- Log Location/etc/suricata- Config Location, including location of the rule files
To collect pcap and run pcap against Suricata Rules
- To write to a pcap with tcpdump:
sudo tcpdump -i <interface> -w <output_file.pcap>
- To run Suricata against a pcap:
sudo suricata -r /path/to/traffic.pcap -c /etc/suricata/suricata.yaml -l /var/log/suricata
- To run against ONE Rule:
sudo suricata -r /path/to/pcap/file.pcap -c /etc/suricata/suricata.yaml -S /etc/suricata/rules/single-rule.rules -l /var/log/suricata
Splunk Forwarding Command Setup
# Backup config and remove forwarder
sudo cp -r /opt/splunkforwarder/etc /tmp/splunkfwd-backup
sudo rm -rf /opt/splunkforwarder

# Downloading
wget -O splunkforwarder-9.4.0-6b4ebe426ca6-linux-amd64.deb "https://download.splunk.com/products/universalforwarder/releases/9.4.0/linux/splunkforwarder-9.4.0-6b4ebe426ca6-linux-amd64.deb"

# Installing
sudo dpkg -i splunkforwarder-9.4.0-6b4ebe426ca6-linux-amd64.deb

# Accepting License
# Username and Password should be the same as Splunk Enterprise
sudo /opt/splunkforwarder/bin/splunk start --accept-license

# Configuring suricata log monitoring
sudo /opt/splunkforwarder/bin/splunk add monitor /var/log/suricata/alerts-only.json

# curl for Splunk health check
curl -v http://54.82.106.217:8000/services/collector/health

# Applying HEC Splunk Token
sudo nano /opt/splunkforwarder/etc/system/local/outputs.conf

# outputs.conf
[httpout]
defaultGroup = hec_group

[httpout:hec_group]
server = localhost:8000
token = 1581b601-60a8-4731-9d9a-6cc3a51e6c36

# Restarting
sudo /opt/splunkforwarder/bin/splunk restart

# Test Event
 echo '{"event": "Test log from Universal Forwarder"}' | sudo tee -a /var/log/suricata/alerts-only.json > /dev/null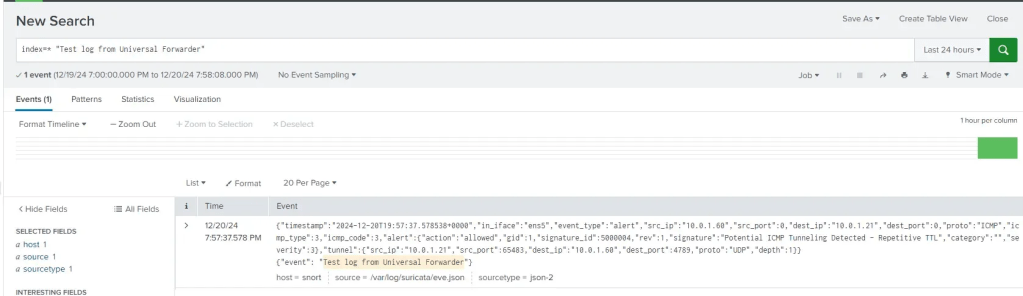
Simulating Windows Attacks
- By cross-referencing the modules from PurpleSharp and Atomic Red Team I created a realistic attack scenario with a realistic attack chain.
Overview of the Attack Chain
- Initial Access: The attack begins with brute-forcing passwords and spearphishing, which are both highly effective initial access techniques. These approaches exploit weak credentials and user susceptibility to malicious attachments or links, making them a reliable entry point.
- Reconnaissance and Discovery: Once access is gained, the attacker shifts focus to gathering intelligence about the target environment. Account discovery, group policy review, and Kerberoasting are methods to identify high-value accounts and privilege escalation opportunities within Active Directory. These steps prepare the attacker for lateral movement while minimizing noise.
- Privilege Escalation and Persistence: Techniques like token impersonation, creating local accounts, and modifying autostart mechanisms ensure the attacker can operate with elevated privileges and survive system reboots or credential changes. These actions make the attack chain harder to detect and disrupt.
- Lateral Movement: With techniques such as Pass-the-Hash and ingress tool transfer, the attacker leverages stolen credentials and tools to propagate across the network. This phase expands their reach within the organization and facilitates broader reconnaissance.
- Data Exfiltration: The attacker collects and archives data for exfiltration, using encrypted non-C2 protocols like HTTPS to evade network monitoring. These techniques are highly effective in bypassing traditional data loss prevention tools.
Why This Chain is Realistic
- Combines Proven TTPs: The techniques in this chain align with real-world attack patterns observed in Advanced Persistent Threat (APT) campaigns and common malware behaviors. Many of these steps rely on built-in tools and protocols, making them harder to detect.
- Leverages Misconfigurations and Weaknesses: The attack capitalizes on organizational weaknesses, such as weak passwords, improperly configured Active Directory environments, and insufficient monitoring of PowerShell or registry changes.
- Minimizes Detection: The use of native tools (e.g., PowerShell, Kerberos) and encrypted communication protocols ensures the attacker’s actions blend into normal network activity.
- End-to-End Coverage: The chain covers all key phases of an attack—initial access, discovery, persistence, lateral movement, and exfiltration. This structured approach mirrors frameworks like MITRE ATT&CK, showing the attacker's methodical progression.
- Applicable Across Environments: These techniques are platform-agnostic, meaning they can be adapted to various environments (e.g., Windows, hybrid, or cloud), enhancing the realism of the chain.
| T1110.001 | Brute-Force: Password Guessing |
| T1566.001 | Phishing: Spearphishing Attachment |
| T1087.002 | Account Discovery: Domain Account |
| T1615 | Group Policy Discovery |
| T1558.003 | Steal or Forge Kerberos Tickets: Kerberoasting |
| T1134.001 | Access Token Manipulation: Token Impersonation/Theft |
| T1136.001 | Create Account: Local Account |
| T1547.001 | Boot or Logon Autostart Execution: Registry Run Keys / Startup Folder |
| T1550.002 | Use Alternate Authentication Material: Pass the Hash |
| T1105 | Ingress Tool Transfer |
| T1071.001 | Application Layer Protocol: Web Protocols |
| T1059.001 | Command and Scripting Interpreter: PowerShell |
| T1560.001 | Archive Collected Data: Archive via Utility |
| T1048.002 | Exfiltration Over Alternative Protocol: Exfiltration Over Asymmetric Encrypted Non-C2 Protocol |
Simulating and Detecting Network Attacks
flightsim is a lightweight utility used to generate malicious network traffic and help security teams to evaluate security controls and network visibility. The tool performs tests to simulate DNS tunneling, DGA traffic, requests to known active C2 destinations, and other suspicious traffic patterns.
- To install:
- Download the flightsim_2.5.1_linux_amd64.tar.gz on a Linux machine and unzip.
- You can pick which modules you want to simulate, here's the full list of modules that can be emulated, along with a large library of C2 families for the C2 module.
| Module | Description |
| c2 | Generates both DNS and IP traffic to a random list of known C2 destinations |
| cleartext | Generates random cleartext traffic to an Internet service operated by AlphaSOC |
| dga | Simulates DGA traffic using random labels and top-level domains |
| imposter | Generates DNS traffic to a list of imposter domains |
| irc | Connects to a random list of public IRC servers |
| miner | Generates Stratum mining protocol traffic to known cryptomining pools |
| oast | Simulates out-of-band application security testing (OAST) traffic |
| scan | Performs a port scan of random RFC 5737 addresses using common TCP ports |
| sink | Connects to known sinkholed destinations run by security researchers |
| spambot | Resolves and connects to random Internet SMTP servers to simulate a spam bot |
| ssh-exfil | Simulates an SSH file transfer to a service running on a non-standard SSH port |
| ssh-transfer | Simulates an SSH file transfer to a service running on an SSH port |
| telegram-bot | Generates Telegram Bot API traffic using a random or provided token |
| tunnel-dns | Generates DNS tunneling requests to *.sandbox.alphasoc.xyz |
| tunnel-icmp | Generates ICMP tunneling traffic to an Internet service operated by AlphaSOC |
- I chose to run a mix of the most important modules, and a few interesting ones, like DGA traffic and Cryptomining traffic.
- Here’s a bash script I wrote to run all of the modules I chose, and for it to output the logs to a file after.
#!/bin/bash

# Log file location
LOGFILE="flightsim_log.txt"

echo "Starting FlightSim simulations..." | tee -a $LOGFILE

# Run C2 Cobalt Strike
echo "Running: C2 Cobalt Strike" | tee -a $LOGFILE
flightsim run c2:havoc >> $LOGFILE 2>&1 || { echo "Error: Cobalt Strike failed" | tee -a $LOGFILE; exit 1; }
sleep 5  # Wait for 5 seconds

# Run Domain Generation Algorithms (DGA)
echo "Running: Domain Generation Algorithms (DGA)" | tee -a $LOGFILE
flightsim run dga >> $LOGFILE 2>&1 || { echo "Error: DGA failed" | tee -a $LOGFILE; exit 1; }
sleep 5

# Run Tunnel-DNS
echo "Running: Tunnel-DNS" | tee -a $LOGFILE
flightsim run tunnel-dns >> $LOGFILE 2>&1 || { echo "Error: Tunnel-DNS failed" | tee -a $LOGFILE; exit 1; }
sleep 5

# Run Tunnel-ICMP
echo "Running: Tunnel-ICMP" | tee -a $LOGFILE
flightsim run tunnel-icmp >> $LOGFILE 2>&1 || { echo "Error: Tunnel-ICMP failed" | tee -a $LOGFILE; exit 1; }
sleep 5

# Run Miner
echo "Running: Miner" | tee -a $LOGFILE
flightsim run miner >> $LOGFILE 2>&1 || { echo "Error: Miner failed" | tee -a $LOGFILE; exit 1; }
sleep 5

# Run Spambot
echo "Running: Spambot" | tee -a $LOGFILE
flightsim run spambot >> $LOGFILE 2>&1 || { echo "Error: Spambot failed" | tee -a $LOGFILE; exit 1; }
sleep 5

# Run SSH-Exfil
echo "Running: SSH-Exfil" | tee -a $LOGFILE
flightsim run ssh-exfil >> $LOGFILE 2>&1 || { echo "Error: SSH-Exfil failed" | tee -a $LOGFILE; exit 1; }
sleep 5

# Run SCAN
echo "Running: SCAN" | tee -a $LOGFILE
flightsim run scan >> $LOGFILE 2>&1 || { echo "Error: SCAN failed" | tee -a $LOGFILE; exit 1; }
sleep 5

echo "All FlightSim simulations completed successfully!" | tee -a $LOGFILE- I ran the script, captured the network traffic, and opened it in Wireshark to extract IOCs, such as websites, common patterns, and ports, and used those IOCs for Suricata. Opening the pcap in Wireshark also confirmed to me that the traffic was being generated.
- Rule files are then placed in
/etc/suricata/rules
Custom Rule and Alert Creation / Portfolio
- Most of my time was spent creating Suricata Alerts, Threat Hunting for Windows Attacks, and creating alerts from the two attack types.
- Here are my complete set of Suricata rules and Windows Alerts:
Windows Alerts
- T1110.001 / Password Guessing Detection
index=* (source=win*security OR sourcetype=linux_secure OR tag=authentication) user=* user!=""
| eval action=case(
    EventCode=4624, "success",
    EventCode=4625, "failure",
    EventCode=4776, "failure",
    EventCode=4771, "failure",
    true(), "unknown"
)
| bin _time span=1h
| stats count(eval(action="failure")) as failures count(eval(action="success")) as successes values(src_ip) as src_ips by user _time
| where failures > 10 AND successes > 0
| eval brute_force_detected=if(failures > 10 AND successes > 0, "yes", "no")
| mvexpand src_ips
| eval ip_category=if(
    cidrmatch("10.0.0.0/8", src_ips) OR cidrmatch("172.16.0.0/12", src_ips) OR cidrmatch("192.168.0.0/16", src_ips),
    "Private",
    "Public"
)
| iplocation src_ips
| stats values(failures) as failures values(successes) as successes values(brute_force_detected) as brute_force_detected values(ip_category) as ip_categories values(City) as cities values(Country) as countries by user _time src_ips
| table _time user src_ips ip_categories failures successes brute_force_detected cities countries- T1566.001 / Spearphishing Attachment Detection
index=win sourcetype=XmlWinEventLog EventCode IN (4104, 11, 1)
| where match(file_name, ".*\.(xlsm|pdf|xls|xlsx|doc|docx|ppt|pptx|rtf|odt|txt)$")
| search process_name="powershell.exe"
| stats count by _time EventCode file_name User process_name file_path
| where count > 0- T1087.002 / Account Discovery: Domain Account
index=win sourcetype=XmlWinEventLog CommandLine=*
| where match(CommandLine, "(?i)\bnet\s?(user|group|localgroup)\b")
| eval _time=strftime(_time, "%Y-%m-%d %H:%M:%S")
| stats count by _time user host CommandLine ParentCommandLine- T1615 / Group Policy Discovery
index=win sourcetype=XmlWinEventLog CommandLine=*
| search CommandLine="*gpresult*"
| stats count by _time user host CommandLine
index=win sourcetype=XmlWinEventLog CommandLine=*
| search CommandLine="*Get-DomainGPO*"
| stats count by _time user host CommandLine EventCodeindex=win sourcetype=XmlWinEventLog CommandLine=*
| search CommandLine="*GPOAudit*"
| stats count by _time user host CommandLine EventCodeindex=win sourcetype=XmlWinEventLog CommandLine=*
| search CommandLine="*GPORemoteAccessPolicy*"
| stats count by _time user host CommandLine EventCodeindex=win sourcetype=XmlWinEventLog CommandLine=*
| search CommandLine="*Get-GPO*"
| stats count by _time user host CommandLine EventCode- T1615 / Kerberoasting
index=win sourcetype=XmlWinEventLog EventID=4104
| search ScriptBlockText="*SetThreadToken*" OR ScriptBlockText="*Get-SystemToken*" OR ScriptBlockText="*Get-SystemNamedPipe*" OR ScriptBlockText="*WNetAddConnection2*" OR ScriptBlockText="*net use*" OR ScriptBlockText="*New-PSDrive*"
| eval DetectionCategory=case(
    match(ScriptBlockText, "(?i)(SetThreadToken|Get-SystemToken|Get-SystemNamedPipe)"), "LogonUser API",
    match(ScriptBlockText, "(?i)(WNetAddConnection2|net use|New-PSDrive)"), "WNetAddConnection2 API",
    true(), "Uncategorized"
)
| stats count by _time UserID Computer ScriptBlockText DetectionCategory- T1136.001 / Access Token Manipulation: Token Impersonation/Theft
index=win sourcetype=XmlWinEventLog CommandLine=*
| search CommandLine="*Get-System*"
| stats count by _time CommandLine ParentCommandLine ParentUser
index=win sourcetype=XmlWinEventLog
| search CommandLine="*nsudo*" OR CommandLine="*-U:T*" OR CommandLine="*-P:E*"
| stats count by _time host User CommandLineindex=win sourcetype=XmlWinEventLog EventCode=1 IntegrityLevel="High"
| where like(CommandLine, "%Potato.exe%")
| table _time user CommandLine IntegrityLevel host- T1136.001 / Create Account: Local Account
index=win sourcetype=XmlWinEventLog CommandLine=*
| search CommandLine="*net user /add*"
| table _time User Host CommandLine
index=win sourcetype=XmlWinEventLog CommandLine=*
| search CommandLine="*New-LocalUser*"
| table _time User Host CommandLineindex=win sourcetype=XmlWinEventLog CommandLine=*
| search CommandLine="*net localgroup administrators*"
| table _time User Host CommandLine- T1547.001 / Boot or Logon Autostart Execution: Registry Run Keys / Startup Folder
index=win sourcetype=XmlWinEventLog EventCode=1 IntegrityLevel="High"
| search CommandLine="*REG ADD*" CommandLine="*\\Run*"
| table _time User Host CommandLine IntegrityLevel
index=win sourcetype=XmlWinEventLog CommandLine=*
| search CommandLine="*Set-ItemProperty*" CommandLine="*RunOnce*"
| table _time User Host CommandLineindex=win sourcetype=XmlWinEventLog CommandLine=*
| search CommandLine="*cscript.exe*" CommandLine="*Microsoft\\Windows\\Start Menu\\Programs\\Startup\\*"
| table _time User Host CommandLineindex=win sourcetype=XmlWinEventLog EventCode=11
| search TargetFilename="*Microsoft\\Windows\\Start Menu\\Programs\\Startup\\*.bat"
| table _time TargetFilename User hostindex=win sourcetype=XmlWinEventLog EventCode=11
| search TargetFilename="*Microsoft\\Windows\\Start Menu\\Programs\\Startup\\*.lnk"
| table _time TargetFilename User hostindex=win sourcetype=XmlWinEventLog EventCode=13
| search TargetObject="*HKCR\\CLSID\\{645FF040-5081-101B-9F08-00AA002F954E}\\shell\\open\\command*"
| table _time User host TargetObject Detailsindex=win sourcetype=XmlWinEventLog CommandLine=*
| search CommandLine="*powershell.exe*" CommandLine="*-ExecutionPolicy Bypass*" CommandLine="*-windowstyle hidden*"
| table _time User Host CommandLineindex=win sourcetype=XmlWinEventLog
| search TargetObject="*HKLM\\SOFTWARE\\Microsoft\\Windows\\CurrentVersion\\Explorer\\User Shell Folders\\Common Startup*" OR TargetFilename="*$env:TMP\\atomictest*" OR CommandLine="*calc.exe*"
| stats count by _time User host Image CommandLine SHA256 ParentCommandLine index=win sourcetype=XmlWinEventLog
| search TargetObject="*HKCU\\Software\\Microsoft\\Windows\\CurrentVersion\\Explorer\\User Shell Folders\\Startup*" OR TargetFilename="*$env:TMP\\atomictest*" OR CommandLine="*calc.exe*"
| rex field=process "(?<extracted_registry_key>HK(?:CR|CU|LM|U|CC)\\\\[^\\\\]+\\\\(?:[^\\\\]+\\\\)*[^\\\\]*)"
| stats count by _time OriginalFileName User host parent_process_name CommandLine extracted_registry_keyindex=win sourcetype=XmlWinEventLog
| search TargetObject="*HKCU\\Software\\Microsoft\\Windows\\CurrentVersion\\Policies\\Explorer\\Run*" OR CommandLine="*calc.exe*"
| rex field=process "(?<extracted_registry_key>HK(?:CR|CU|LM|U|CC)\\\\[^\\\\]+\\\\(?:[^\\\\]+\\\\)*[^\\\\]*)"
| stats count by _time ParentUser host CommandLine extracted_registry_keyindex=win sourcetype=XmlWinEventLog
| search TargetObject="*HKLM\\Software\\Microsoft\\Windows NT\\CurrentVersion\\Winlogon\\Userinit*" OR CommandLine="*calc.exe*"
| rex field=process "(?<extracted_registry_key>HK(?:CR|CU|LM|U|CC)\\\\[^\\\\]+\\\\(?:[^\\\\]+\\\\)*[^\\\\]*)"
| stats count by _time ParentUser host CommandLine extracted_registry_keyindex=win sourcetype=XmlWinEventLog
| search TargetObject="*HKLM\\Software\\Microsoft\\Windows NT\\CurrentVersion\\Winlogon\\Shell*" OR CommandLine="*explorer.exe*" OR CommandLine="*calc.exe*"
| rex field=process "(?<extracted_registry_key>HK(?:CR|CU|LM|U|CC)\\\\[^\\\\]+\\\\(?:[^\\\\]+\\\\)*[^\\\\]*)"
| stats count by _time ParentUser host CommandLine extracted_registry_keyindex=win sourcetype=XmlWinEventLog
| search TargetObject="*HKLM\\Software\\Microsoft\\Windows\\CurrentVersion\\Run*" OR CommandLine="*secedit*"
| rex field=CommandLine "(?<secedit_db>\/db\s+([^\/]+))"
| rex field=CommandLine "(?<ini_file>\/cfg\s+([^\/]+))"
| stats count by _time ParentUser host CommandLineindex=win sourcetype=XmlWinEventLog CommandLine="*Set-ItemProperty*"
| rex field=CommandLine "(?i)(?<extracted_registry_key>(HKLM|HKCU|HKCR|HKU|HKCC)[\\:][^\\\"]+)"
| table _time host User CommandLine extracted_registry_key EventCodeindex=win sourcetype=XmlWinEventLog CommandLine="*reg add*"
| search CommandLine="*HKLM\\SYSTEM\\CurrentControlSet\\Control\\Terminal Server\\Wds\\rdpwd*"
| rex field=CommandLine "(?i)(?<extracted_registry_key>(HKLM|HKCU|HKCR|HKU|HKCC)\\\\[^\"]+)"
| table _time host User CommandLine extracted_registry_key EventCodeindex=win sourcetype=XmlWinEventLog CommandLine="*reg add*"
| search CommandLine="*HKLM\\System\\CurrentControlSet\\Control\\BootVerificationProgram*"
| rex field=CommandLine "(?i)(?<extracted_registry_key>(HKLM|HKCU|HKCR|HKU|HKCC)\\\\[^\"]+)"
| table _time host User CommandLine extracted_registry_key EventCode- T1550.002 / Use Alternate Authentication Material: Pass the Hash
source="XmlWinEventLog:Security" EventCode IN (4768,4769,4776,4625)
| rex field=user "(?<username>[^@]+)"
| rex field=src_ip "(\:\:ffff\:)?(?<src_ip_4>[0-9\.]+)"
| transaction username, src_ip_4 maxspan=10h keepevicted=true startswith=(EventCode=4768)
| search NOT user="*$@*"
| stats count values(EventCode) as EventCodes values(Computer) as Computers values(service_name) as ServiceNames values(subject) as Subjects values(LogonType) as LogonTypes earliest(_time) as FirstEvent latest(_time) as LastEvent by username, src_ip_4
| eval Category=case(
    count > 10 AND (like(EventCodes, "%4625%") OR like(EventCodes, "%4776%")), "Brute Force Detected",
    count > 3 AND (like(EventCodes, "%4768%") OR like(EventCodes, "%4769%")), "Potential Pass-the-Hash Activity",
    count <= 3, "Normal Authentication Behavior",
    true(), "Uncategorized"
)
| where count > 3
| table FirstEvent, LastEvent, username, src_ip_4, count, EventCodes, Computers, ServiceNames, Subjects, LogonTypes, Category
index=win sourcetype="XmlWinEventLog" EventID=1
| search CommandLine="*sekurlsa::pth*" OR CommandLine="*ntlm:*" OR CommandLine="*mimikatz*"
| eval AttackType=case(
like(CommandLine,"%sekurlsa::pth%"), "Pass-the-Hash Attempt",
like(CommandLine,"%mimikatz%"), "Mimikatz Detected",
like(CommandLine,"%ntlm%"), "Potential NTLM Abuse",
true(), "Uncategorized"
)
| table _time, ParentCommandLine, CommandLine, ParentImage, Image, User, Computer, AttackType- T1105 / Ingress Tool Transfer
index=win source="XmlWinEventLog:Microsoft-Windows-Sysmon/Operational" EventCode=11
| search NOT TargetFilename="*PSScriptPolicyTest*" NOT TargetFilename="*NativeImages*" NOT TargetFilename="*WindowsPowershell*" NOT TargetFilename="*\*\*\*\*.dll" NOT "*.cmdline*" NOT TargetFilename="C:\\ProgramData\\chocolatey\\*"
| search TargetFilename="*.exe" OR TargetFilename="*.ps1" OR TargetFilename="*.dll" OR TargetFilename="*.bat" OR TargetFilename="*.vbs" OR TargetFilename="*.zip"
| eval SuspiciousDirectory=if(match(TargetFilename, "C:\\\\Users\\\\Public\\\\") OR match(TargetFilename, "C:\\\\Temp\\\\") OR match(TargetFilename, "C:\\\\Windows\\\\Temp\\\\"), "Yes", "No")
| eval SuspiciousProcess=if(match(Image, "powershell.exe") OR match(Image, "curl.exe") OR match(Image, "wget.exe") OR match(Image, "certutil.exe") OR match(Image, "git.exe") OR match(Image, "bitsadmin.exe"), "Yes", "No")
| table _time, TargetFilename, Image, SuspiciousDirectory, SuspiciousProcess- T1071.001 / Application Layer Protocol: Web Protocols
index=win source="XmlWinEventLog:Microsoft-Windows-Sysmon/Operational" EventCode=1
| search Image="*powershell.exe"
| where match(CommandLine, "(?i)Invoke-WebRequest|Invoke-RestMethod")
| eval SuspiciousBehavior=if(match(CommandLine, "(?i)(-UserAgent)|(-Uri)|(-Headers)"), "Yes", "No")
| eval SuspiciousPatterns=if(
    match(CommandLine, "(?i)(curl|wget|certutil|http://|https://)") OR
    match(CurrentDirectory, "(?i)temp|public"), "Yes", "No")
| search SuspiciousBehavior="Yes" OR SuspiciousPatterns="Yes"
| table _time, Computer, User, CommandLine, CurrentDirectory, SuspiciousBehavior, SuspiciousPatterns
index=win source="XmlWinEventLog:Microsoft-Windows-Sysmon/Operational" EventCode=1
| search Image="*curl.exe"
| eval SuspiciousBehavior=if(match(CommandLine, "(?i)(-A\\s\"HttpBrowser|Wget|Opera|<\\|>)"), "Yes", "No")
| eval SuspiciousDirectory=if(match(CurrentDirectory, "(?i)(temp|public)"), "Yes", "No")
| eval HighRisk=if(SuspiciousBehavior="Yes" OR SuspiciousDirectory="Yes", "Yes", "No")
| table _time, Computer, User, CommandLine, CurrentDirectory, SuspiciousBehavior, SuspiciousDirectory, HighRisk- T1059.001 / Command and Scripting Interpreter: PowerShell
index=win sourcetype=XmlWinEventLog EventCode=1
| where match(CommandLine, "(?i)powershell.exe.*(-command|-encodedcommand)")
OR match(CommandLine, "(?i)System\.Management\.Automation")
OR match(CommandLine, "(?i)ConvertTo-SecureString")
| dedup CommandLine
| table _time, User, Computer, parent_process_name, CommandLine
| sort _time- T1560.001 / Archive Collected Data: Archive via Utility
index=win sourcetype=XmlWinEventLog *rar.exe*
| eval CommandCategory = case(
    match(CommandLine, "(?i)a -r"), "Attack Command",
    match(CommandLine, "(?i)bitsadmin|echo"), "Prerequisite Command",
    true(), "Other"
)
| stats count by _time, User, Computer, parent_process_name, CommandCategory, CommandLine, ParentCommandLiune
index=win sourcetype=XmlWinEventLog EventCode=*
| where match(CommandLine, "(?i)rar\.exe.*-hp")
OR match(CommandLine, "(?i)winrar\.exe.*-hp")
| stats count by _time, User, Computer, parent_process_name, CommandLine, ParentCommandLine
| dedup CommandLineindex=win sourcetype=XmlWinEventLog EventCode=*
| where match(CommandLine, "(?i)winzip.*-min.*-a.*-s")
| stats count by _time, User, Computer, parent_process_name, CommandLine, ParentCommandLine
| dedup CommandLineindex=win sourcetype=XmlWinEventLog EventCode=*
| where match(CommandLine, "(?i)7z\.exe.*u.*-p")
| stats count by _time, User, Computer, parent_process_name, CommandLine, ParentCommandLine
| dedup CommandLineindex=win sourcetype=XmlWinEventLog EventCode=*
| where match(CommandLine, "(?i)plink\.exe.*-ssh.*-l.*-pw")
OR match(CommandLine, "(?i)esxcli.*syslog.*config.*set.*--loghost")
OR match(CommandLine, "(?i)findstr.*\[0-9]{1,3}\.[0-9]{1,3}\.[0-9]{1,3}\.[0-9]{1,3}")
OR match(CommandLine, "(?i)Get-Content.*loghost\.txt")
| eval CommandCategory = case(
match(CommandLine, "(?i)plink\.exe.*-ssh.*-l.*-pw"), "ESXi Remote Access via Plink",
match(CommandLine, "(?i)findstr.*\[0-9]{1,3}\.[0-9]{1,3}\.[0-9]{1,3}\.[0-9]{1,3}"), "Suspicious IP Extraction",
match(CommandLine, "(?i)esxcli.*syslog.*config.*set.*--loghost"), "ESXi Syslog Configuration Change",
true(), "Other"
)
| stats count by _time, User, Computer, CommandCategory, parent_process_name, CommandLine, ParentCommandLine
| dedup CommandLineindex=win sourcetype=XmlWinEventLog EventCode=1
| where match(CommandLine, "(?i)makecab\.exe.*\.hiv.*\.zip")
OR match(CommandLine, "(?i)makecab\.exe.*c:\\temp\\sam\.hiv.*c:\\temp\\art\.zip")
| eval CommandCategory = case(
match(CommandLine, "(?i)makecab\.exe.*"), "File Compression with Makecab",
match(CommandLine, "(?i)fsutil.*createnew.*\.hiv"), "Prerequisite File Creation",
match(CommandLine, "(?i)del.*\.zip"), "Cleanup Command",
true(), "Other"
)
| stats count by _time, User, Computer, CommandCategory, parent_process_name, CommandLine, ParentCommandLine
| dedup CommandLine- T1048.002 / Exfiltration Over Alternative Protocol: Exfiltration Over Asymmetric Encrypted Non-C2 Protocol
index=win sourcetype=XmlWinEventLog EventCode=1
| where match(CommandLine, "(?i)curl\.exe.*-k.*-f.*https://")
| stats count by _time, User, Computer, parent_process_name, CommandLine, ParentCommandLine
| dedup CommandLine
Suricata Rules
- DGA (Domain Generation Algorithm Traffic)
# Detect specific DGA Top-Level Domains (TLDs)
alert udp $HOME_NET any -> $EXTERNAL_NET 53 (msg:"DGA TLD Detected - .top"; content:".top"; nocase; sid:3100001; rev:2;)
alert udp $HOME_NET any -> $EXTERNAL_NET 53 (msg:"DGA TLD Detected - .xyz"; content:".xyz"; nocase; sid:3100002; rev:2;)
alert udp $HOME_NET any -> $EXTERNAL_NET 53 (msg:"DGA TLD Detected - .info"; content:".info"; nocase; sid:3100003; rev:2;)
alert udp $HOME_NET any -> $EXTERNAL_NET 53 (msg:"DGA TLD Detected - .space"; content:".space"; nocase; sid:3100004; rev:2;)
alert udp $HOME_NET any -> $EXTERNAL_NET 53 (msg:"DGA TLD Detected - .biz"; content:".biz"; nocase; sid:3100005; rev:2;)

# Detect high entropy domain names (randomized alphanumeric strings)
alert udp $HOME_NET any -> $EXTERNAL_NET 53 (msg:"DGA High Entropy Domain Detected"; pcre:"/^[a-z0-9]{7,10}\.[a-z]{2,5}$/i"; sid:3100006; rev:2;)

# Detect domain names with a single random digit substitution
alert udp $HOME_NET any -> $EXTERNAL_NET 53 (msg:"DGA Domain with Random Digit Detected"; pcre:"/[a-z]{1,}[0-9]{1,}[a-z]{1,}/i"; sid:3100007; rev:2;)

# Detect multiple DNS queries in a short burst (indicating potential DGA activity)
alert udp $HOME_NET any -> $EXTERNAL_NET 53 (msg:"Potential DGA Activity - Repeated Queries"; flow:to_server; content:"|00|"; depth:1; threshold:type both, track by_src, count 10, seconds 10; sid:3100008; rev:2;)- TUNNEL-DNS (DNS Tunneling Traffic)
# ---------------------------------------------------------------------------
# Rule 1: Detect queries to the specific domain "sandbox.alphasoc.xyz"
# ---------------------------------------------------------------------------
alert udp $HOME_NET any -> $EXTERNAL_NET 53 (msg:"DNS Tunneling - Query to sandbox.alphasoc.xyz"; dns_query; content:"sandbox.alphasoc.xyz"; nocase; sid:3200011; rev:4;)

# ---------------------------------------------------------------------------
# Rule 2: Detect DNS queries with long subdomain labels (30+ characters)
# ---------------------------------------------------------------------------
alert udp $HOME_NET any -> $EXTERNAL_NET 53 (msg:"DNS Tunneling - Long Subdomain Detected"; dns_query; pcre:"/^[a-z0-9]{30,}\./i"; sid:3200012; rev:4;)

# ---------------------------------------------------------------------------
# Rule 3: Detect excessive DNS TXT record queries from the same source
# ---------------------------------------------------------------------------
alert udp $HOME_NET any -> $EXTERNAL_NET 53 (msg:"DNS Tunneling - Excessive TXT Record Queries"; dns_query; content:"TXT"; nocase; threshold:type both, track by_src, count 10, seconds 5; sid:3200013; rev:4;)

# ---------------------------------------------------------------------------
# Rule 4: Detect frequent DNS queries to the same domain "sandbox.alphasoc.xyz"
# ---------------------------------------------------------------------------
alert udp $HOME_NET any -> $EXTERNAL_NET 53 (msg:"DNS Tunneling - Repeated Queries to sandbox.alphasoc.xyz"; dns_query; content:"sandbox.alphasoc.xyz"; nocase; threshold:type both, track by_src, count 5, seconds 10; sid:3200014; rev:4;)

# ---------------------------------------------------------------------------
# Rule 5: Detect DNS queries to domains with the suspicious ".xyz" TLD
# ---------------------------------------------------------------------------
alert udp $HOME_NET any -> $EXTERNAL_NET 53 (msg:"DNS Tunneling - Query to .xyz Domain"; dns_query; pcre:"/\.xyz$/i"; sid:3200015; rev:4;)

# ---------------------------------------------------------------------------
# Rule 6: Detect DNS queries with high entropy subdomains (indicative of encoded data)
# ---------------------------------------------------------------------------
alert udp $HOME_NET any -> $EXTERNAL_NET 53 (msg:"DNS Tunneling - High Entropy Subdomain Detected"; dns_query; pcre:"/^[a-zA-Z0-9]{40,}\./i"; sid:3200016; rev:2;)

# ---------------------------------------------------------------------------
# Rule 7: Detect DNS queries with both ".xyz" TLD and long subdomains
# ---------------------------------------------------------------------------
alert udp $HOME_NET any -> $EXTERNAL_NET 53 (msg:"DNS Tunneling - Long Subdomain with .xyz TLD Detected"; dns_query; pcre:"/^[a-z0-9]{30,}\..*\.xyz$/i"; sid:3200017; rev:2;)- TUNNEL-ICMP (ICMP Tunneling Traffic)
# ---------------------------------------------------------------------------
# Rule 1: Detect large ICMP packets (likely tunneling) with repetitive patterns
# ---------------------------------------------------------------------------
alert icmp $HOME_NET any -> $EXTERNAL_NET any (msg:"ICMP Tunneling - Large Payload Detected"; dsize:>1400; itype:8; content:"AAAAAAAA"; depth:8; sid:3300001; rev:3;)
alert icmp $EXTERNAL_NET any -> $HOME_NET any (msg:"ICMP Tunneling - Large Payload Detected"; dsize:>1400; itype:0; content:"AAAAAAAA"; depth:8; sid:3300002; rev:3;)

# ---------------------------------------------------------------------------
# Rule 2: Detect high-frequency ICMP communication between two hosts
# ---------------------------------------------------------------------------
alert icmp $HOME_NET any -> $EXTERNAL_NET any (msg:"ICMP Tunneling - High Frequency Communication Detected"; threshold:type both, track by_src, count 10, seconds 10; flow:stateless; sid:3300003; rev:2;)

# ---------------------------------------------------------------------------
# Rule 3: Detect repetitive TTL values often indicative of tunneling
# ---------------------------------------------------------------------------
alert icmp $HOME_NET any -> $EXTERNAL_NET any (msg:"ICMP Tunneling - Repetitive TTL Values Detected"; ttl:64; dsize:>100; threshold:type both, track by_src, count 10, seconds 30; flow:stateless; sid:3300004; rev:3;)

# ---------------------------------------------------------------------------
# Rule 4: Detect ICMP packets with unusual payload sizes
# ---------------------------------------------------------------------------
alert icmp $HOME_NET any -> $EXTERNAL_NET any (msg:"ICMP Tunneling - Unusual Payload Size Detected"; dsize:128; itype:8; sid:3300005; rev:1;)
alert icmp $EXTERNAL_NET any -> $HOME_NET any (msg:"ICMP Tunneling - Unusual Payload Size Detected"; dsize:128; itype:0; sid:3300006; rev:1;)

# ---------------------------------------------------------------------------
# Rule 5: Detect ICMP packets with high entropy (potentially encoded data)
# ---------------------------------------------------------------------------
alert icmp $HOME_NET any -> $EXTERNAL_NET any (msg:"ICMP Tunneling - High Entropy Payload Detected"; pcre:"/[\x00-\xFF]{100,}/"; dsize:>200; sid:3300007; rev:1;)
alert icmp $EXTERNAL_NET any -> $HOME_NET any (msg:"ICMP Tunneling - High Entropy Payload Detected"; pcre:"/[\x00-\xFF]{100,}/"; dsize:>200; sid:3300008; rev:1;)- MINER (Cryptomining Traffic)
# ---------------------------------------------------------------------------
# Detect connections to specific cryptomining pool IPs
# ---------------------------------------------------------------------------
alert tcp $HOME_NET any -> 144.217.7.188 7777 (msg:"Cryptomining Traffic Detected - 144.217.7.188:7777"; sid:3400001; rev:2;)
alert tcp $HOME_NET any -> 188.25.112.139 4443 (msg:"Cryptomining Traffic Detected - 188.25.112.139:4443"; sid:3400002; rev:2;)
alert tcp $HOME_NET any -> 88.80.187.187 3333 (msg:"Cryptomining Traffic Detected - 88.80.187.187:3333"; sid:3400003; rev:2;)
alert tcp $HOME_NET any -> 172.104.84.180 3333 (msg:"Cryptomining Traffic Detected - 172.104.84.180:3333"; sid:3400004; rev:2;)
alert tcp $HOME_NET any -> 43.153.210.9 13008 (msg:"Cryptomining Traffic Detected - 43.153.210.9:13008"; sid:3400005; rev:2;)
alert tcp $HOME_NET any -> 172.104.151.182 2786 (msg:"Cryptomining Traffic Detected - 172.104.151.182:2786"; sid:3400006; rev:2;)
alert tcp $HOME_NET any -> 37.26.136.250 any (msg:"Cryptomining Traffic Detected - 37.26.136.250 (any port)"; sid:3400007; rev:2;)
alert tcp $HOME_NET any -> 139.162.81.190 7777 (msg:"Cryptomining Traffic Detected - 139.162.81.190:7777"; sid:3400008; rev:2;)
alert tcp $HOME_NET any -> 194.233.171.171 any (msg:"Cryptomining Traffic Detected - 194.233.171.171 (any port)"; sid:3400009; rev:2;)
alert tcp $HOME_NET any -> 35.75.151.209 3009 (msg:"Cryptomining Traffic Detected - 35.75.151.209:3009"; sid:3400010; rev:2;)
alert tcp $HOME_NET any -> 144.76.222.140 8000 (msg:"Cryptomining Traffic Detected - 144.76.222.140:8000"; sid:3400011; rev:2;)
alert tcp $HOME_NET any -> 45.79.188.191 7777 (msg:"Cryptomining Traffic Detected - 45.79.188.191:7777"; sid:3400012; rev:2;)

# ---------------------------------------------------------------------------
# Detect connections to common cryptomining ports
# ---------------------------------------------------------------------------
alert tcp $HOME_NET any -> $EXTERNAL_NET 3333 (msg:"Cryptomining Traffic Detected - Common Port 3333"; flow:to_server,established; sid:3400013; rev:2;)
alert tcp $HOME_NET any -> $EXTERNAL_NET 7777 (msg:"Cryptomining Traffic Detected - Common Port 7777"; flow:to_server,established; sid:3400014; rev:2;)
alert tcp $HOME_NET any -> $EXTERNAL_NET 8000 (msg:"Cryptomining Traffic Detected - Common Port 8000"; flow:to_server,established; sid:3400015; rev:2;)
alert tcp $HOME_NET any -> $EXTERNAL_NET 13008 (msg:"Cryptomining Traffic Detected - Common Port 13008"; flow:to_server,established; sid:3400016; rev:2;)
alert tcp $HOME_NET any -> $EXTERNAL_NET 4443 (msg:"Cryptomining Traffic Detected - Common Port 4443"; flow:to_server,established; sid:3400017; rev:2;)
alert tcp $HOME_NET any -> $EXTERNAL_NET 2786 (msg:"Cryptomining Traffic Detected - Common Port 2786"; flow:to_server,established; sid:3400018; rev:2;)
alert tcp $HOME_NET any -> $EXTERNAL_NET 3443 (msg:"Cryptomining Traffic Detected - Common Port 3443"; flow:to_server,established; sid:3400019; rev:2;)

# ---------------------------------------------------------------------------
# Detect high-frequency connections to cryptomining-related IPs or ports
# ---------------------------------------------------------------------------
alert tcp $HOME_NET any -> $EXTERNAL_NET [3333,4444,5555,6666] (msg:"Cryptomining Traffic Detected - High Frequency"; flow:to_server; threshold:type both, track by_src, count 5, seconds 10; sid:3400020; rev:2;)

# ---------------------------------------------------------------------------
# Stratum Protocol Detection Rules
# ---------------------------------------------------------------------------
alert tcp $HOME_NET any -> $EXTERNAL_NET any (msg:"Cryptocurrency Mining - Stratum Protocol Detected"; content:"mining.subscribe"; nocase; sid:3400021; rev:2;)
alert tcp $EXTERNAL_NET any -> $HOME_NET any (msg:"Cryptocurrency Mining - Stratum Response Detected"; content:"mining.notify"; nocase; sid:3400022; rev:2;)
alert tcp $EXTERNAL_NET any -> $HOME_NET any (msg:"Cryptocurrency Mining - Stratum Authorization Detected"; content:"mining.authorize"; nocase; sid:3400023; rev:2;)

# ---------------------------------------------------------------------------
# Detect connections to specific mining pool domains
# ---------------------------------------------------------------------------
alert tcp $HOME_NET any -> $EXTERNAL_NET any (msg:"Cryptocurrency Mining - Connection to Known Mining Pool"; content:"sandbox.alphasoc.xyz"; http_header; sid:3400024; rev:2;)

# ---------------------------------------------------------------------------
# Detect high-volume "mining.subscribe" requests
# ---------------------------------------------------------------------------
alert tcp $HOME_NET any -> $EXTERNAL_NET any (msg:"Cryptocurrency Mining - High Volume Traffic Detected"; flow:to_server; content:"mining.subscribe"; nocase; threshold:type both, track by_src, count 5, seconds 10; sid:3400025; rev:2;)

# ---------------------------------------------------------------------------
# Detect JSON-RPC "mining.subscribe" requests within Stratum protocol
# ---------------------------------------------------------------------------
alert tcp $HOME_NET any -> $EXTERNAL_NET any (msg:"Cryptocurrency Mining - JSON-RPC Request Detected"; content:"jsonrpc"; content:"mining.subscribe"; distance:0; within:50; sid:3400026; rev:2;)

# ---------------------------------------------------------------------------
# Detect high-entropy domain names in DNS queries
# ---------------------------------------------------------------------------
alert dns $HOME_NET any -> $EXTERNAL_NET any (msg:"Cryptocurrency Mining - High Entropy Domain Detected"; pcre:"/^[a-z0-9]{30}\./"; sid:3400027; rev:2;)- SPAMBOT (SMTP Traffic)
# ---------------------------------------------------------------------------
# Rule 1: Detect generic SMTP traffic (All outgoing SMTP connections)
# ---------------------------------------------------------------------------
alert tcp $HOME_NET any -> $EXTERNAL_NET 25 (msg:"Spambot Activity - Generic SMTP Traffic Detected"; flow:to_server,established; sid:4000001; rev:1;)

# ---------------------------------------------------------------------------
# Rule 2: Detect high-frequency SMTP connections (Rapid connections)
# ---------------------------------------------------------------------------
alert tcp $HOME_NET any -> $EXTERNAL_NET 25 (msg:"Spambot Activity - High Frequency SMTP Connections"; flow:to_server,established; threshold:type both, track by_src, count 5, seconds 10; sid:4000002; rev:1;)

# ---------------------------------------------------------------------------
# Rule 3: Detect SMTP traffic to known mail server domains (Content Matching)
# ---------------------------------------------------------------------------
alert tcp $HOME_NET any -> $EXTERNAL_NET 25 (msg:"Spambot Activity - Connection to Known Mail Server"; content:"MAIL FROM"; content:"orange.fr"; nocase; sid:4000003; rev:1;)
alert tcp $HOME_NET any -> $EXTERNAL_NET 25 (msg:"Spambot Activity - Connection to Known Mail Server"; content:"MAIL FROM"; content:"yahoo.com"; nocase; sid:4000004; rev:1;)
alert tcp $HOME_NET any -> $EXTERNAL_NET 25 (msg:"Spambot Activity - Connection to Known Mail Server"; content:"MAIL FROM"; content:"hotmail.com"; nocase; sid:4000005; rev:1;)
alert tcp $HOME_NET any -> $EXTERNAL_NET 25 (msg:"Spambot Activity - Connection to Known Mail Server"; content:"MAIL FROM"; content:"gmail.com"; nocase; sid:4000006; rev:1;)
alert tcp $HOME_NET any -> $EXTERNAL_NET 25 (msg:"Spambot Activity - Connection to Known Mail Server"; content:"MAIL FROM"; content:"outlook.com"; nocase; sid:4000007; rev:1;)
alert tcp $HOME_NET any -> $EXTERNAL_NET 25 (msg:"Spambot Activity - Connection to Known Mail Server"; content:"MAIL FROM"; content:"zoho.com"; nocase; sid:4000008; rev:1;)

# ---------------------------------------------------------------------------
# Rule 4: Detect repeated SMTP connections to the same mail server
# ---------------------------------------------------------------------------
alert tcp $HOME_NET any -> $EXTERNAL_NET 25 (msg:"Spambot Activity - Repeated Connections to Same Mail Server"; flow:to_server,established; threshold:type both, track by_dst, count 3, seconds 30; sid:4000009; rev:1;)

# ---------------------------------------------------------------------------
# Rule 5: Detect DNS queries for MX records of specific domains
# ---------------------------------------------------------------------------
alert dns $HOME_NET any -> $EXTERNAL_NET any (msg:"Spambot Activity - DNS Query for MX Record (orange.fr)"; dns_query; content:"orange.fr"; nocase; sid:4000010; rev:1;)
alert dns $HOME_NET any -> $EXTERNAL_NET any (msg:"Spambot Activity - DNS Query for MX Record (yahoo.com)"; dns_query; content:"yahoo.com"; nocase; sid:4000011; rev:1;)
alert dns $HOME_NET any -> $EXTERNAL_NET any (msg:"Spambot Activity - DNS Query for MX Record (hotmail.com)"; dns_query; content:"hotmail.com"; nocase; sid:4000012; rev:1;)
alert dns $HOME_NET any -> $EXTERNAL_NET any (msg:"Spambot Activity - DNS Query for MX Record (gmail.com)"; dns_query; content:"gmail.com"; nocase; sid:4000013; rev:1;)
alert dns $HOME_NET any -> $EXTERNAL_NET any (msg:"Spambot Activity - DNS Query for MX Record (outlook.com)"; dns_query; content:"outlook.com"; nocase; sid:4000014; rev:1;)
alert dns $HOME_NET any -> $EXTERNAL_NET any (msg:"Spambot Activity - DNS Query for MX Record (zoho.com)"; dns_query; content:"zoho.com"; nocase; sid:4000015; rev:1;)

# ---------------------------------------------------------------------------
# Rule 6: Detect SMTP connections to unusual or high-entropy domains
# ---------------------------------------------------------------------------
alert tcp $HOME_NET any -> $EXTERNAL_NET 25 (msg:"Spambot Activity - Connection to Unusual Domain"; content:"MAIL FROM"; pcre:"/@[a-z0-9-]+\.[a-z]{2,}$/"; nocase; sid:4000016; rev:1;)

# ---------------------------------------------------------------------------
# Rule 7: Detect high-entropy DNS queries (Unusual Domains)
# ---------------------------------------------------------------------------
alert dns $HOME_NET any -> $EXTERNAL_NET any (msg:"Spambot Activity - High Entropy Domain Detected in DNS Query"; pcre:"/^[a-z0-9]{10,}\.[a-z]{2,}$/"; sid:4000017; rev:1;)- SSH-EXFIL
# ---------------------------------------------------------------------------
# Rule 1: Detect SSH traffic on non-standard ports
# ---------------------------------------------------------------------------
alert tcp $HOME_NET any -> $EXTERNAL_NET 443 (msg:"Potential SSH exfiltration detected on port 443"; flow:to_server,established; content:"SSH-"; depth:4; sid:3600001; rev:2;)
alert tcp $HOME_NET any -> $EXTERNAL_NET 465 (msg:"Potential SSH exfiltration detected on port 465"; flow:to_server,established; content:"SSH-"; depth:4; sid:3600002; rev:2;)
alert tcp $HOME_NET any -> $EXTERNAL_NET 993 (msg:"Potential SSH exfiltration detected on port 993"; flow:to_server,established; content:"SSH-"; depth:4; sid:3600003; rev:2;)
alert tcp $HOME_NET any -> $EXTERNAL_NET 995 (msg:"Potential SSH exfiltration detected on port 995"; flow:to_server,established; content:"SSH-"; depth:4; sid:3600004; rev:2;)
alert tcp $HOME_NET any -> $EXTERNAL_NET [1:21,23:65535] (msg:"Potential SSH exfiltration on non-standard port"; flow:to_server,established; content:"SSH-"; depth:4; sid:3600005; rev:3;)

# ---------------------------------------------------------------------------
# Rule 2: Detect large data transfers (approx. 200MB)
# ---------------------------------------------------------------------------
alert tcp $HOME_NET any -> $EXTERNAL_NET any (msg:"Potential large SSH data exfiltration (200MB+)"; flow:to_server,established; content:"SSH-"; depth:4; dsize:>1400; threshold:type both, track by_src, count 150000, seconds 60; sid:3600006; rev:3;)

# ---------------------------------------------------------------------------
# Rule 3: Detect connections to the specific sandbox domain with payload >140 bytes
# ---------------------------------------------------------------------------
alert tcp $HOME_NET any -> $EXTERNAL_NET any (msg:"SSH exfiltration to suspicious domain ssh.sandbox-services.alphasoc.xyz with large cumulative payload (150MB+)"; flow:to_server,established; content:"ssh.sandbox-services.alphasoc.xyz"; nocase; flowbits:set,suspicious_large_transfer; threshold:type both, track by_src, count 150000, seconds 60; sid:3600007; rev:5;)- SCAN (Port Scanning Traffic)
# ---------------------------------------------------------------------------
# Rule 1: Detect High-Frequency Port Scanning Activity
# ---------------------------------------------------------------------------
alert tcp $EXTERNAL_NET any -> $HOME_NET any (msg:"Potential Port Scan Detected"; flags:S; threshold:type both, track by_src, count 10, seconds 60; sid:3700001; rev:2;)
alert tcp $HOME_NET any -> $EXTERNAL_NET any (msg:"Potential Outbound Port Scan Detected"; flags:S; threshold:type both, track by_src, count 10, seconds 60; sid:3700002; rev:2;)

# ---------------------------------------------------------------------------
# Rule 2: Detect Horizontal Port Scans
# ---------------------------------------------------------------------------
alert tcp $EXTERNAL_NET any -> $HOME_NET any (msg:"Horizontal Port Scan Detected"; flags:S; threshold:type both, track by_src, count 20, seconds 60; sid:3700003; rev:2;)
alert tcp $HOME_NET any -> $EXTERNAL_NET any (msg:"Outbound Horizontal Port Scan Detected"; flags:S; threshold:type both, track by_src, count 20, seconds 60; sid:3700004; rev:2;)

# ---------------------------------------------------------------------------
# Rule 3: Detect Vertical Port Scans
# ---------------------------------------------------------------------------
alert tcp $EXTERNAL_NET any -> $HOME_NET any (msg:"Vertical Port Scan Detected"; flags:S; threshold:type both, track by_dst, count 10, seconds 60; sid:3700005; rev:2;)
alert tcp $HOME_NET any -> $EXTERNAL_NET any (msg:"Outbound Vertical Port Scan Detected"; flags:S; threshold:type both, track by_dst, count 10, seconds 60; sid:3700006; rev:2;)

# ---------------------------------------------------------------------------
# Rule 4: Detect Stealthy Scan Techniques (NULL/XMAS Scans)
# ---------------------------------------------------------------------------
alert tcp $EXTERNAL_NET any -> $HOME_NET any (msg:"Null/XMAS Scan Detected"; flags:0; sid:3700007; rev:2;)
alert tcp $HOME_NET any -> $EXTERNAL_NET any (msg:"Outbound Null/XMAS Scan Detected"; flags:0; sid:3700008; rev:2;)- SSH-TRANSFER
# ---------------------------------------------------------------------------
# Rule 1: Detect connections to the AlphaSOC sandbox domain
# ---------------------------------------------------------------------------
alert tcp $HOME_NET any -> $EXTERNAL_NET 22 (msg:"SSH Transfer Detected - AlphaSOC Sandbox Connection"; content:"alphasoc"; nocase; content:".xyz"; distance:0; nocase; flow:to_server,established; sid:4200001; rev:3;)
alert dns $HOME_NET any -> $EXTERNAL_NET any (msg:"SSH Transfer Detected - DNS Query to AlphaSOC Sandbox"; content:"alphasoc"; nocase; content:".xyz"; distance:0; nocase; sid:4200006; rev:3;)

# ---------------------------------------------------------------------------
# Rule 2: Detect SSH sessions with large cumulative data transfer (>200MB)
# ---------------------------------------------------------------------------
alert tcp $HOME_NET any -> $EXTERNAL_NET 22 (msg:"SSH Transfer Detected - Large File Transfer (>200MB)"; flow:to_server,established; flowbits:set,ssh_large_transfer; byte_test:5,>,209715200,0,relative; sid:4200002; rev:3;)

# ---------------------------------------------------------------------------
# Rule 3: Detect SSH client activity with specific AlphaSOC client names
# ---------------------------------------------------------------------------
alert tcp $HOME_NET any -> $EXTERNAL_NET 22 (msg:"SSH Transfer Detected - Suspicious Client Name Detected"; pcre:"/alphasoc-|ssh-tool-|malware-ssh/"; flow:to_server,established; sid:4200003; rev:3;)

# ---------------------------------------------------------------------------
# Rule 4: Detect frequent SSH connections from the same source
# ---------------------------------------------------------------------------
alert tcp $HOME_NET any -> $EXTERNAL_NET 22 (msg:"SSH Transfer Detected - High Frequency SSH Connections"; flow:to_server,established; threshold:type both, track by_src, count 3, seconds 10; sid:4200004; rev:3;)

# ---------------------------------------------------------------------------
# Rule 5: Detect SSH traffic with session establishment (Key Exchange)
# ---------------------------------------------------------------------------
alert tcp $HOME_NET any -> $EXTERNAL_NET 22 (msg:"SSH Traffic Detected - Key Exchange"; content:"SSH-"; depth:4; pcre:"/^SSH-\d\.\d/"; flow:to_server,established; sid:4200005; rev:3;)

# ---------------------------------------------------------------------------
# Rule 6: Detect DNS queries to AlphaSOC sandbox domain
# ---------------------------------------------------------------------------
alert dns $HOME_NET any -> $EXTERNAL_NET any (msg:"Suspicious DNS Query Detected - AlphaSOC Sandbox"; content:"sandbox-services"; nocase; content:"alphasoc.xyz"; distance:0; nocase; sid:3600011; rev:3;)

# ---------------------------------------------------------------------------
# Rule 7: Detect SSH traffic to non-standard ports
# ---------------------------------------------------------------------------
alert tcp $HOME_NET any -> $EXTERNAL_NET [1:21,23:79,81:65535] (msg:"SSH Traffic Detected - Non-Standard Port"; flow:to_server,established; content:"SSH-"; depth:4; sid:4200007; rev:3;)
Creating Dashboards
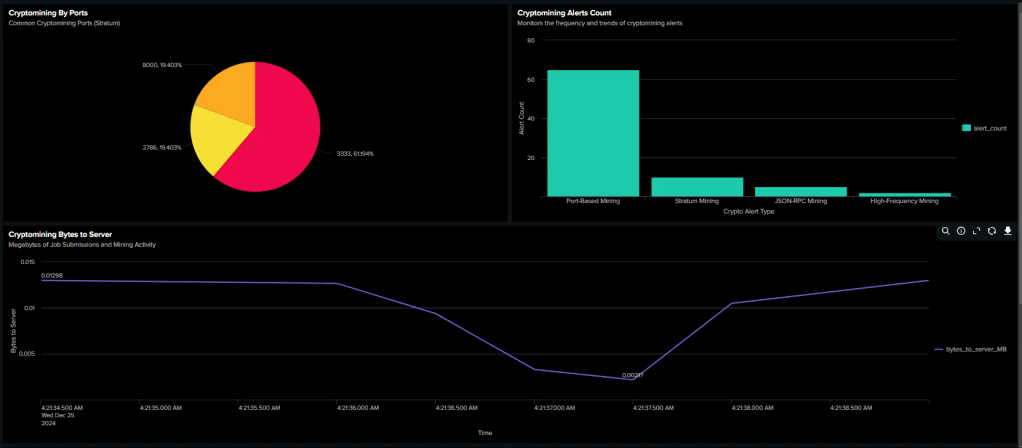
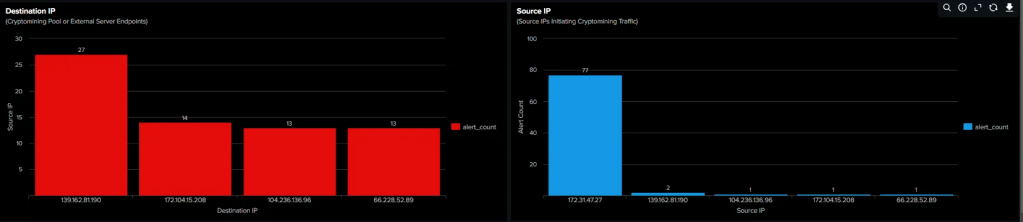
Cryptomining
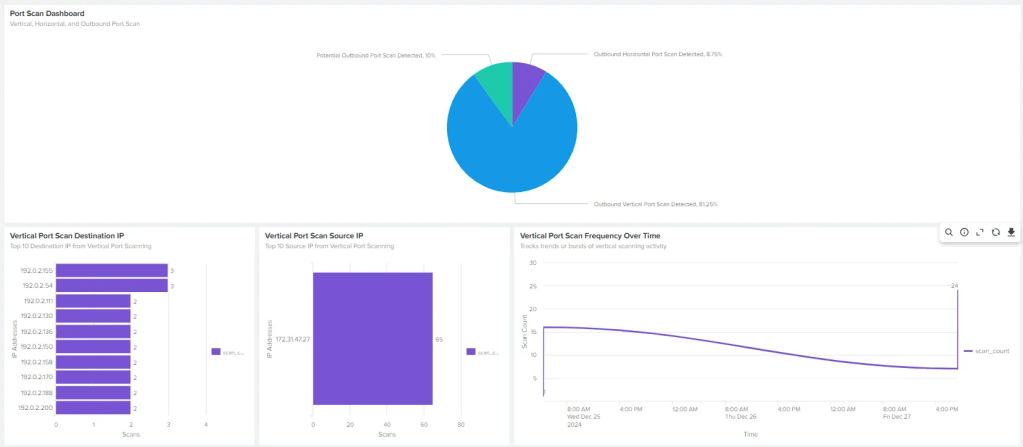
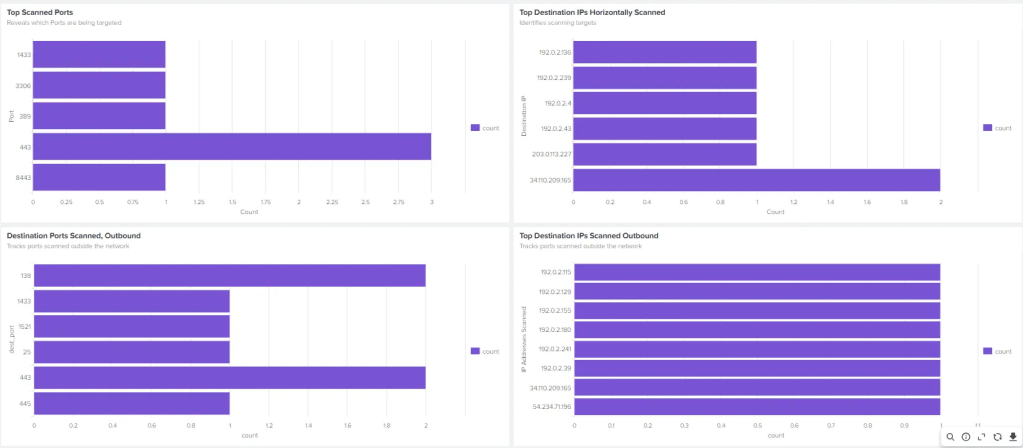
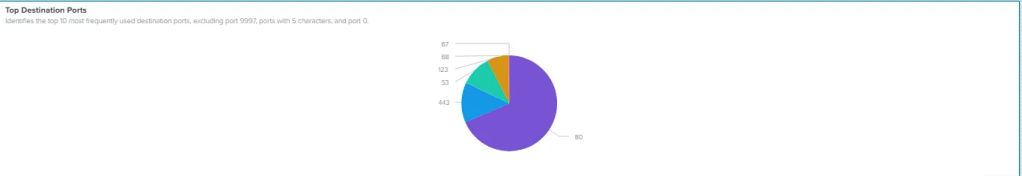
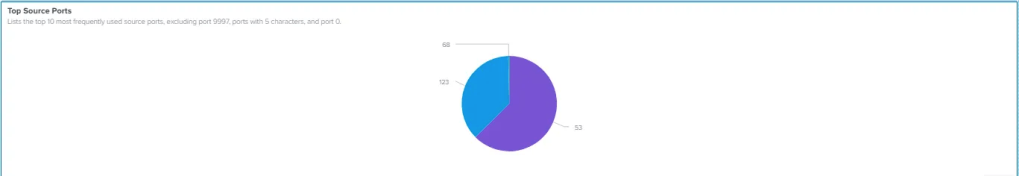
Network Scanning
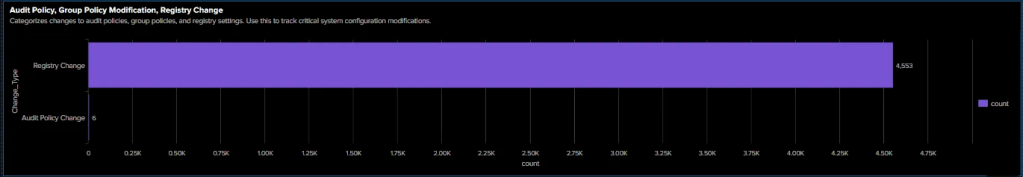
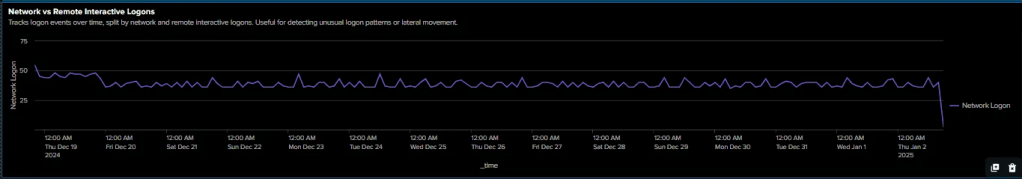
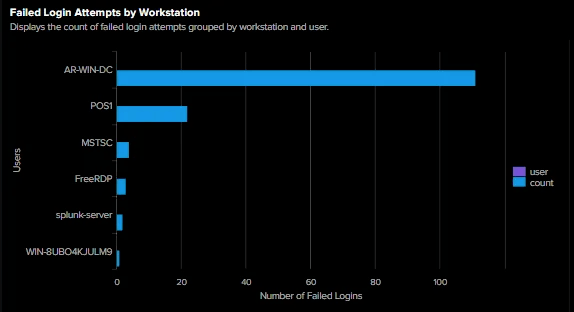
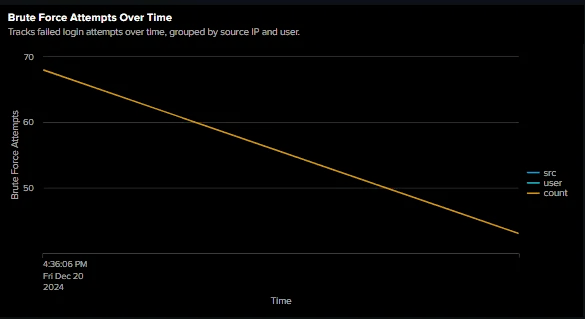
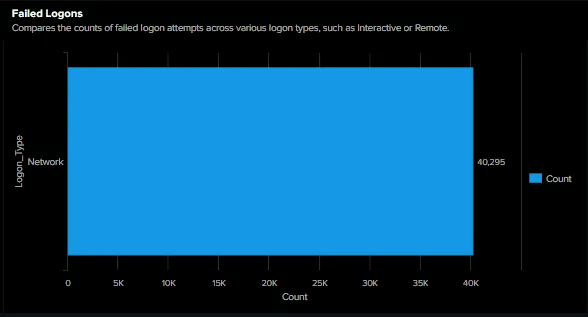
Windows Dashboard: Policy and Lateral Movement
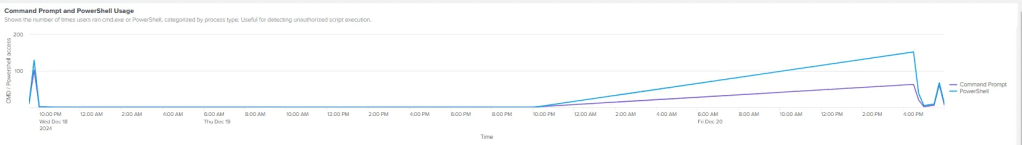
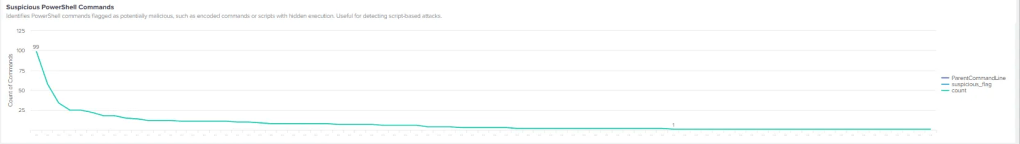
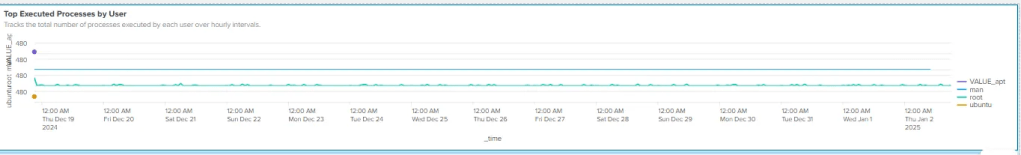
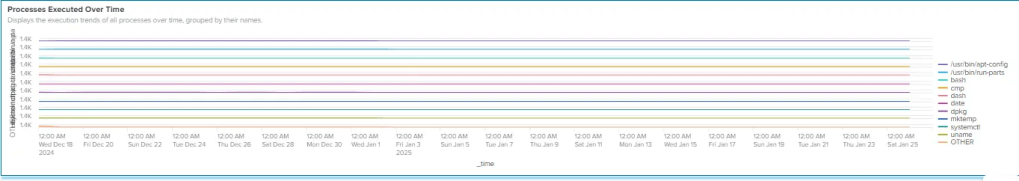
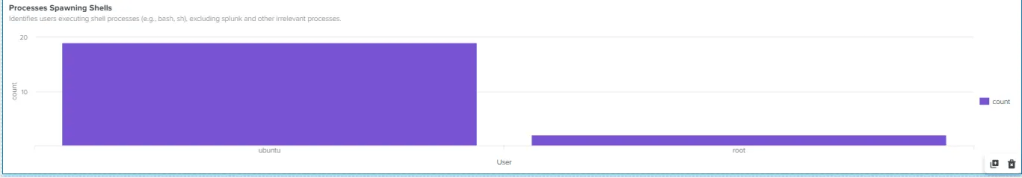
Windows Dashboard: Process Monitoring
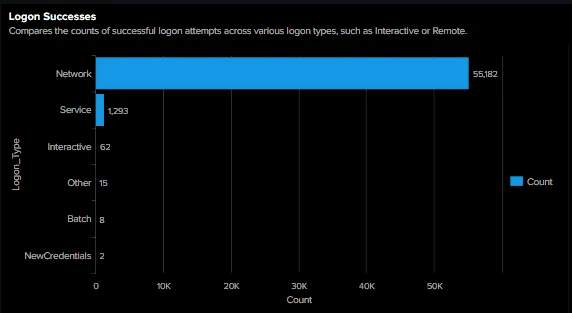
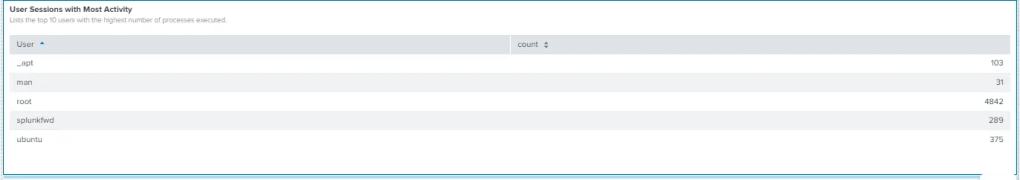
Windows Dashboard: User and Account Activities
Linux Dashboard: System Activity Monitoring
Key Findings and Results for Splunk Engineering Project
Key Findings
- User and Process Monitoring:
- Queries tracked user activity while filtering out routine processes, reducing noise and improving focus on anomalies.
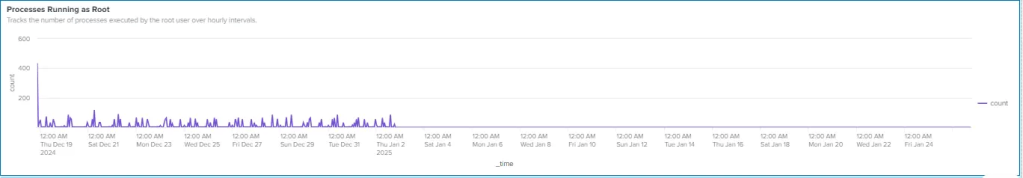
- Elevated accounts like
rootandAdministratorwere monitored closely to detect unauthorized privilege escalation attempts. - Processes executed from unusual directories or with unexpected parent processes flagged potential threats.
- Simulated Windows Attacks Detection:
- Credential Theft:
- Monitored suspicious access to processes like
lsass.exe. - Tracked the use of tools associated with password dumping or credential extraction.
- Monitored suspicious access to processes like
- Persistence Mechanisms:
- Unusual parent-child process relationships involving
cmd.exeandpowershell.exewere identified. - Processes running from non-standard paths or unsigned binaries were flagged as suspicious.
- Unusual parent-child process relationships involving
- Lateral Movement:
- SMB and RDP connections to multiple internal IPs were visualized to detect lateral movement attempts.
- Reconnaissance through port scanning or connection sweeps to multiple internal endpoints was uncovered.
- Credential Theft:
- Network Activity Analysis:
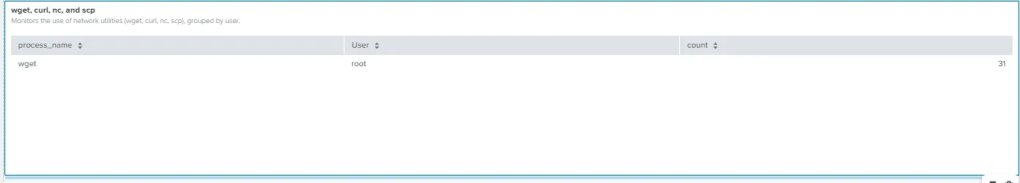
- Queries revealed frequent usage of non-standard or uncommon ports, which might indicate unauthorized data transfer or scanning.
- Network utilities such as
wgetandcurlwere tracked to detect file transfers and potential malware downloads. - Alerts were created to monitor external connections to untrusted IPs, identifying spikes in suspicious outbound traffic.
- Simulated Network Attacks Detection:
- Reconnaissance:
- Detected multiple destination ports being probed by internal or external sources.
- Spotted unusual source ports generating repeated outbound traffic.
- Exfiltration:
- Processes establishing external connections were monitored for unusual bandwidth or unknown destination IPs.
- Tools like
scpor unexpected file transfer activity were flagged for further review.
- Reconnaissance:
Results
- Dashboards Delivered Targeted Threat Insights:
- User-based dashboards highlighted trends in process execution for both standard users and privileged accounts.
- Network activity panels visualized potential data exfiltration attempts and unauthorized access patterns.
- A balance was struck between monitoring Linux- and Windows-specific threats to ensure full coverage.
- Detection of Realistic Adversarial Behaviors:
- Credential theft, lateral movement, and privilege escalation were detected using process monitoring and unusual parent-child relationships.
- Network-based attacks, including port scanning, DGA traffic, and unauthorized external connections, were uncovered.
- Custom queries ensured visibility into abnormal system behavior across platforms.
- Enhanced Threat Visibility with Suricata Integration:
- Suricata rules augmented Splunk's dashboards by adding alerts for cryptomining, SSH brute force attempts, and data exfiltration scenarios.
- Combined insights from network traffic and process execution provided a multi-layered defense strategy.
Supporting Materials
https://www.splunk.com/en_us/blog/learn/splunk-universal-forwarder.html
https://github.com/splunk/attack_range
https://attack-range.readthedocs.io/en/latest/
https://www.purplesharp.com/en/latest/home/purplesharp.html
https://attack.mitre.org/techniques/enterprise/
https://github.com/redcanaryco/atomic-red-team
https://github.com/alphasoc/flightsim
https://releases.ubuntu.com/jammy/